What is Thumbstop Ratio (TSR)?
Thumbstop Ratio or TSR expressed as a percentage is a measure of how effective a video creative is in the ad auction. This metric is not an officially recognized metric by Meta or Tik Tok. Though it is a useful tool when attempting to standardize and quantify video ad creative engagement. Generally, the higher the ratio the better engaging the video creative is. The minimum TSR to be considered for an ad creative will be revealed at the end of this article. Largely this is a secondary KPI and really doesn’t stand on its own.
A lot of media buyers and agencies tout this metric as a useful measure of ad performance. I want to be very clear, this is a measure of ad engagement. I have written a piece about Facebook Metrics and What They Mean. TSR is to be considered an engagement metric and nothing more. To use this metric as an objective source of truth about ad performance is flawed. I’ll explain why with examples and photos throughout this article.
In this analysis I’m going to uncover the relationship between TSR and performance metrics to determine if there is any meaningful association to be gleaned.
What is the formula for Thumbstop ratio?
3 Second Video Views/Impressions
To use this, you must create a custom Meta Ads metric.
Why should you care about TSR?
If you’re TSR is less than 40%, you should start caring. If it’s higher, maybe you shouldn’t.
I’ve heard it so many times. Usually coming from someone who doesn’t manage ads daily. The question is usually something like “have you ever looked at video play to make ad decisions?” Of course I have, but I have no idea how to use it. I have no idea what a good video play rate or bad video play is. I’ve looked at it relative to other ads, but it seems to be purely random, especially when an algorithm is at play.
So to quell the discussions any further, let’s take a deep dive into the nuances of TSR and see if we can glean anything together. But, first, we need data and a proper study setup. Fortunately, I don’t lack data. Seeing as I manage large, 5-6 figure/day media buying budgets, I’ll have an abundance of data to work with. I have no idea how this holds for eCommerce, but the data I am using in this study comes from a single client, albeit multiple ad accounts.
If you want to spare yourself the long read and copious analytics and data, the TLDR of this entire piece is that TSR is useless on its own. In reality, it’s a pretty useless metric for predicting revenue.
Hypothesis
If thumbstop ratio increases, then revenue will increase.
Datasets
The data in this analysis was collected from 26 client accounts during Q1 of 2024 from a direct response info-product business. The total spend was $1,475,251.73 .
All the data was exported via Meta Ad Reports and calculated inside of Google Sheets. The pixel data is accurate within 5% of the true revenue of the business. Largely, there isn’t much a discrepancy between the “source of truth” dataset and the actual pixel/cAPI exported data. Even so, the data is not compared externally and all metrics were recorded by Meta.
2 Data sets were exported. One dataset was broken down by ad creative. The other was broken down by day. Both analysis will be shown in this discussion.
Method
I then ran the data through a pivot table to consolidate ads and days. This way I am able to run reliable calculations on the aggregate raw measurements. The data broken down by ads was filtered to contain only ads that have greater than or equal to $500 in spend. After filtering the data, $1,395,329.04 was included in the dataset spend with 403 ads.
This is to minimize potential outliers and establish baseline measurements with the creatives. As we all know, things generally perform well at low budget.
The following metrics were calculated after the pivot table was created:
- TSR%: 3 second video plays/impressions
- CTR: Clicks/Impressions
- ROAS: Purchases Conversion Value/Amount Spent
- CPA: Amount Spent/Purchases
- CPC: Amount Spent/Link Clicks
Data was organized by the TSR%. The highest spending ad had a total spend of $51,725.63 (Maximum) and the lowest spending (Minimum) ad was $501.69.
Variables
- Independent Variable: Thumbstop Ratio (TSR%)
- Dependent Variables: CTR, ROAS, CPA, CPC, Spend, Revenue
Because we are measuring the other variables against TSR%, the other variables we are measuring are the dependent variables and TSR% is the independent variable. In other words, the other variables depend on the TSR% and we will see if any of them change depending on the TSR%.
Scatter Plots
This data was then organized in a scatter plot with a trend line and R² against each normally measured metric. TSR% is measured on the left Y (vertical) axis and the other metric is measured on the right Y (vertical) axis. The R² value will change depending on how the data is sorted.
The R², or coefficient of determination, in a regression analysis is a statistical measure that represents the proportion of the variance in the dependent variable that is predictable from the independent variable(s). In simpler terms, it indicates how well the independent variable(s) explain the variability of the dependent variable. In practice, R² values closer to 1 suggest that the regression model fits the data well, while values closer to 0 indicate poor fit.
The R² value represents how correlated the data is to the trend line. The higher the R² value, the better the regression line represents the data. The highest R² can be 1. Therefore, the closer the R² value is to 1 the more representative the regression line is.
I’ll also be measuring the variance between the TSR% R² value and the dependent variable value. The lower this number, the lower the variance. It can be read that the TSR% line is some number greater association compared to the dependent variable (CPC, CTR, CPA, etc.). Because TSR% is the independent variable, the R² value will stay constant. The R² for TSR% is .869 which means that the regression line is highly representative of the data.
The names of the creatives are obfuscated to maintain confidentiality.
TSR vs CTR
I’ll start with two engagement metrics, though the CTR is more like a performance metric. This is a loose engagement metric because the user is taking the first step in the funnel, he or she is clicking. This is an important point in the user-journey and it would be curious to determine if there is a real association between engagement and action. The data is sorted from lowest to highest CTR. Highest being on the right and lowest being on the left.
By Ad
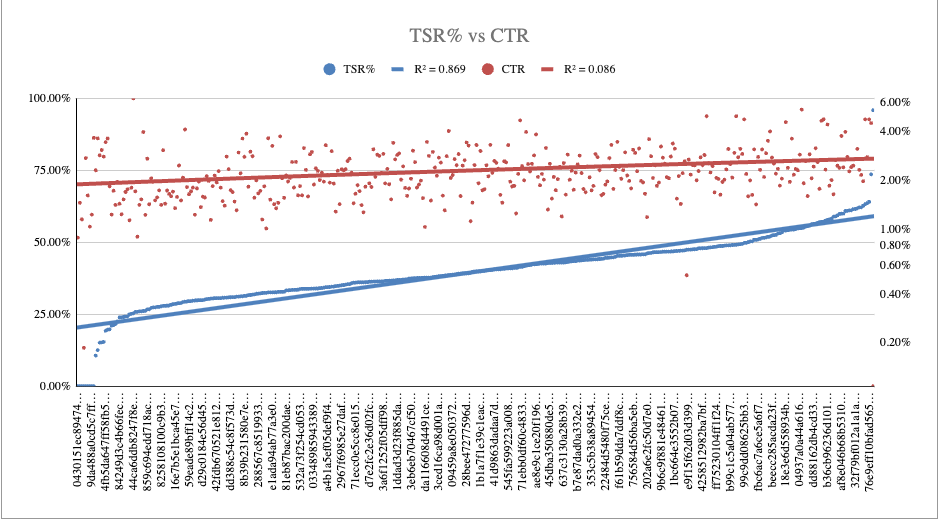
The CTR R² is .086. The TSR% regression line is 10.1x MORE associated with its data than the CTR line. The CTR line has some association with its data, but it’s really weak. So we can assume the line is on a slight slope up. This tells us that indeed, the CTR is increasing from left to right, slightly. Maybe. Maybe it’s coincidence. But what happens with TSR%? It too slowly increases as CTR increases, albeit the relationship is much weaker. Though, the relationship is weaker, this is the most relevant relationship. We can assume that TSR and CTR can trend together and may have some association. As TSR%, so should CTR%. Interesting, this can mean those who are more engaged could be more likely to click as well. But, this doesn’t mean they are more likely to convert. The next chart should offer more clarity on this association.
There really isn’t a strong relationship here. We can loosely say as CTR increases so does TSR.
By Day
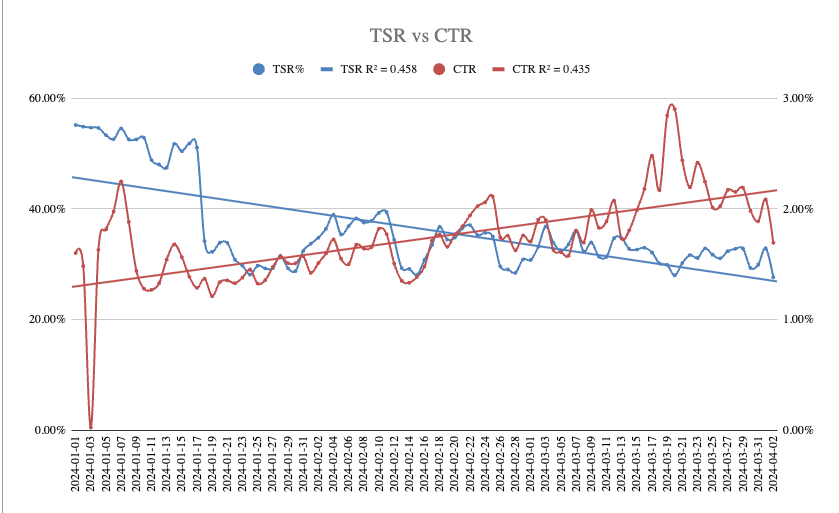
When looking at TSR vs CTR by day a clear patten emerges. Yes, TSR and CTR seem to follow each other with spend being fairly consistent over this time period. We can see the converging lines and fairly significant R² values on both metrics.
Meaning, the trend lines are actually associated with the data. What this data set suggests is that TSR and CTR are inversely correlated. In other words, as CTR increases TSR decreases. But wait, how can that be? Wouldn’t it stand that a user who is highly engaged on a creative would also be more likely to click? According to this, the inverse is true. Basically, a clicker is not an engager. We can see that with the complete opposite trend line patterns (remember, the lines are relevant here because of the high R² value)
Others have argued that there is a very strong association between the two. That the lines follow each other. I would argue that this is sometimes the case but extremely unreliable and inconclusive. The only connection I see is opposition and divergent trends, not convergent trends. So, yes, the lines are tight and follow each other, but the trends are literally opposite.
TSR vs ROAS
Really, the entire point of this exercise for me was to see if we can identify any sort of cutoff or meaningful metric out of TSR% that can be used for ROAS optimization. Can TSR% be used to optimize creatives? Can we use this metric to base our creative decisions on? If so, what’s the cut off and required threshold?
The R²for ROAS is .003 which means the regression line is completely meaningless. It’s nearly 0. The dots are not at all represented by the regression line.
Let’s dive in.
By Ad
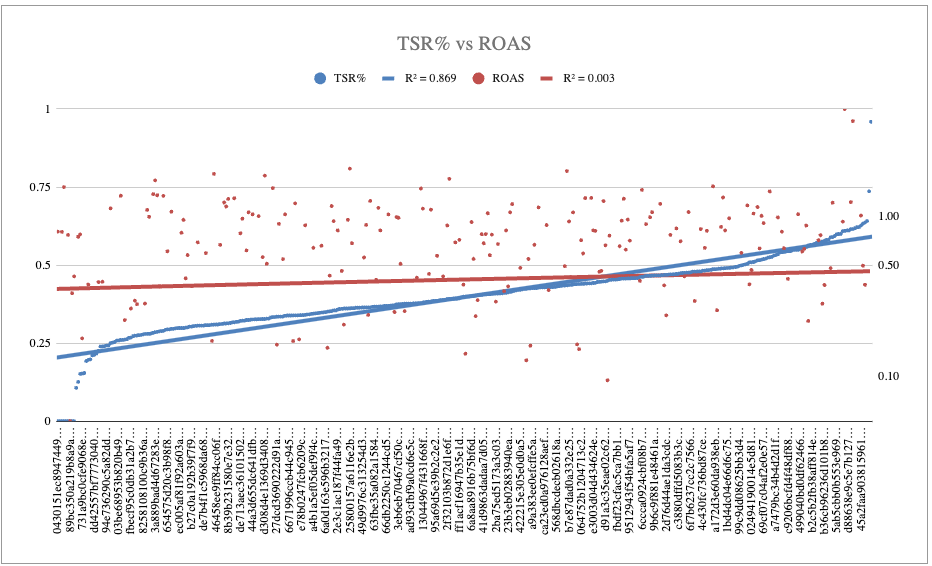
As we can see by this scatter plot, the TSR is 79x more associated with the trend line than ROAS. The R² for the TSR% is just so much higher at .869. Basically, this means that as we go from left to right, the TSR% increases. As TSR% increases, well, ROAS really doesn’t do anything. And it shouldn’t. We shouldn’t expect linear ROAS increases or even higher ROAS because this is more of a downstream funnel metric than an ad metric. Higher TSR% doesn’t mean better ROAS. It should hit the average somewhere around average funnel ROAS. But, alas, the ROAS line is pretty meaningless.
Either way, there’s really no association. Even if there was a higher R² with the ROAS, the line is basically flat as TSR% increases.
This basically tells me the platform doesn’t consider TSR% when optimizing for purchases. It only uses…well…purchases.
By Day
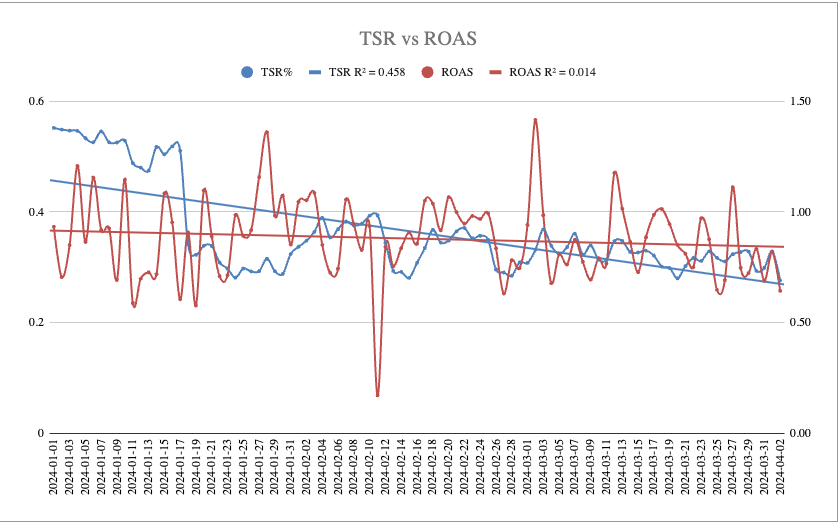
Here we have an interesting and boring pattern emerge. Interesting because upon initial impression looks promising, boring because upon looking at the R² value for ROAS, shows there’s no real trend. It’s fairly flat. As TSR% decreases ROAS maintains the line and stays flat.Which makes a lot of sense, ROAS should be pretty consistent, unless there are dramatic changes to the funnel. Pretty cut and dry here. TSR is beginning to look like a vanity-nice-to-have secondary KPI that doesn’t have significant impact on actual, real-world revenue performance. In other words, TSR is beginning to look like exactly what it is: an engagement metric.
TSR vs CPA
Oh this is getting juicy. This is what I was after the entire time I’ve been looking into this data. What performance data can we glean from TSR? Certainly CPA can share some insights. Let’s take a look. Now the data is sorted by increasing CPA from left to right.
By Ad
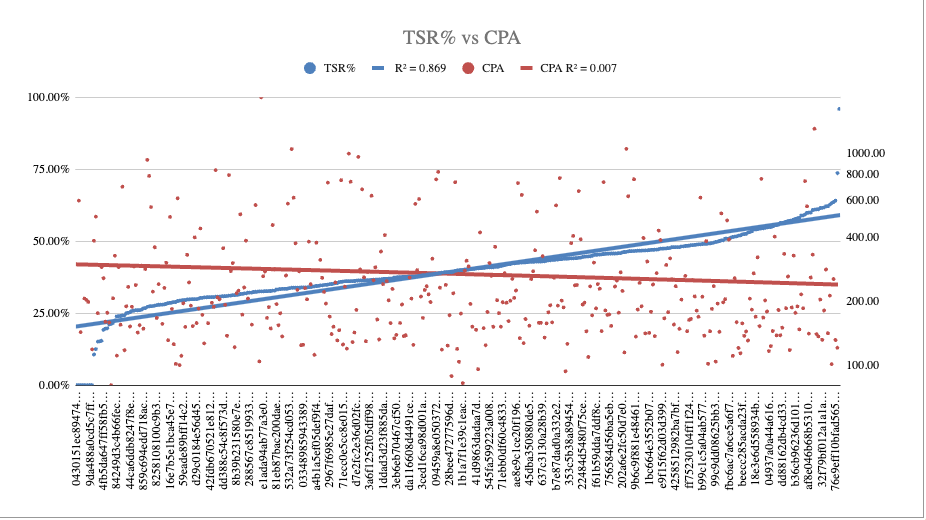
We can see that the CPA R² is .007. This means that the regression line is not really representative of the data. It’s kinda random. The TSR%’s line is 124.14x MORE associated with its data than the CPA line. Basically, this tells me the CPA line is nearly non existent. It’s not even a trend. In fact, it’s just random. As TSR% increases, CPA does nothing.
We can see that as we increase TSR, CPA slightly declines. This is it, this is the thing that will identify the trend and finally explain the correlation I want. But, that would make me a bad scientist and have internal study bias. Let’s not do that. Let’s just look at the data and report the findings.
Welp, this appears to me that as TSR declines CPA increases. Yay, case closed. Except, this is such a nuanced association that it can’t be true. In reality, only the CPA line is highly associated with the actual data and the TSR is again, like when looking at ROAS, pretty meaningless. There is a slight connection between higher CPA and lower TSR, but what’s the range? Looks like sub 40% TSR would indicate a bad ad. We’ll get to that analysis later, but this is an important dataset to pay attention to.
Well, this isn’t looking good for my hypothesis. let’s proceed. Users who are more engaged really don’t impact the CPA. So what are engaged users doing if they aren’t converting? Well, they are watching your ad and scrolling right past it.
From this, I’d say there’s little to no association between TSR% and CPA.
By Day
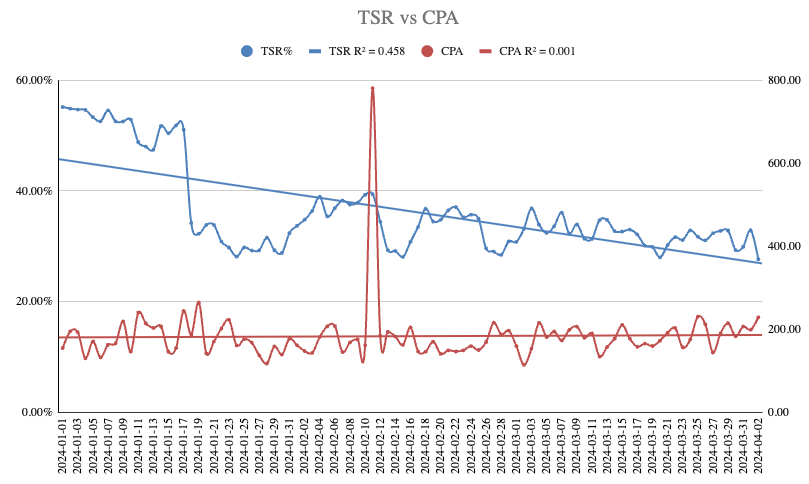
And then I see this. Bummer. Looks like there’s a very strong R² with TSR, but not with CPA. Like CPA is random relative to the TSR. And, to make matters worse, the CPA trend line is flat. This can be read like this: As TSR declines, CPA stays the same.
TSR vs CPC
Ok, how about CPC. Certainly there has to be something here. Some association. My initial hypothesis, which I’m sure yours is too, is that that if I can increase my TSR, then I can reduce my CPC. Let’s see how this holds up. This time the scatter plot is sorted by increasing CPC from left to right. R² for the CPC is .031. The TSR% line is 36x more representative of its data than the TSR%.
By Ad
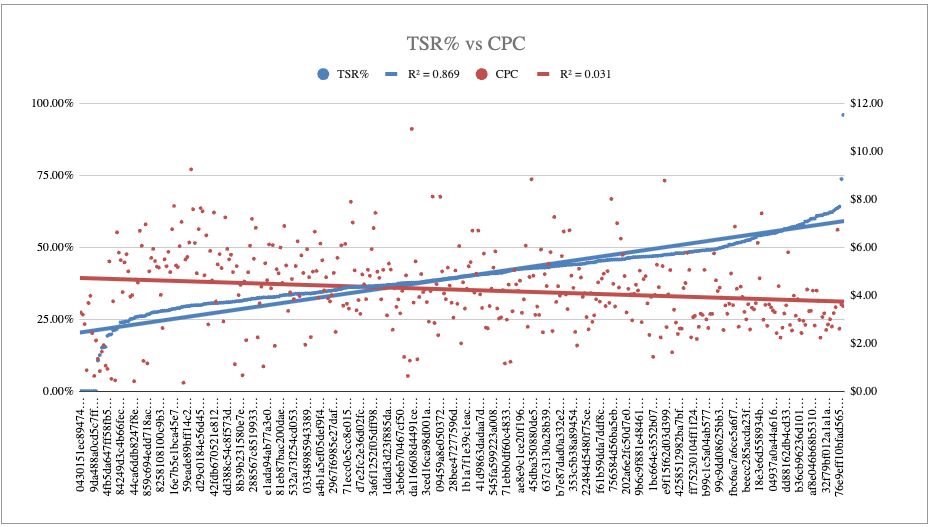
If we just look at the trends without the R² value, we can see that as TSR increases, CPC decreases. But, the R² for the CPC is pretty meaningless. From the data, we really can’t say much about the TSR and CPC. All we can say is that the TSR is increasing from left to right, but CPC is random.
Maybe, maybe there is a slight association, which can indicate that a higher CPC ad can also have a lower TSR, but that’s a bit of a stretch. Take a look at those super low CPC and TSR outliers. One that engages on an ad, could just a be a different person to one who clicks on an ad. This does indeed contradict the CTR% and TSR% chart, but keep in mind the line associations for TSR were relatively weak. These lines are even weaker, so the association breaks down even more.
By Day
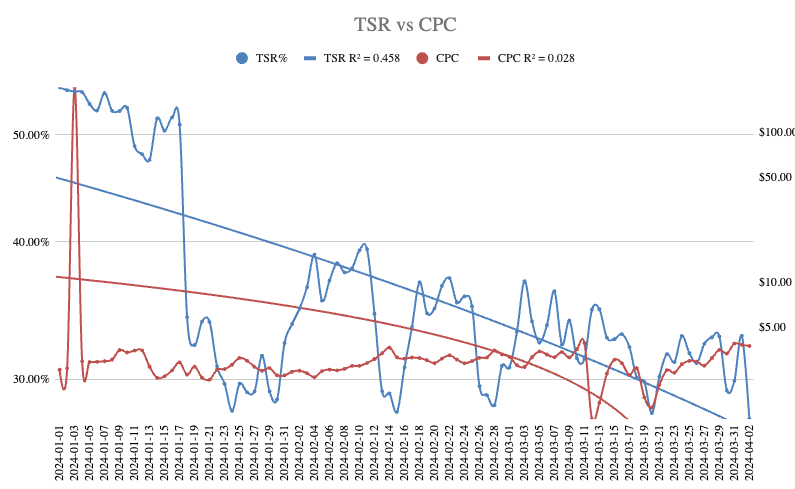
Uhm. When looking at the by-day chart it shows me nothing too interesting either. Because the R² of the CPC is .028, it’s like 10x less than the TSR R². This tells me that the trend lines are pretty meaningless and so is the association. In other words, there really isn’t any association.
TSR vs Spend
This one is interesting as this should highlight a strong relationship between spend and TSR. I should be spending the most on the most engaging ads, right?
The R² for the spend is ..033. The R² is 21x more associated with the TSR than the spend line.
By Ad
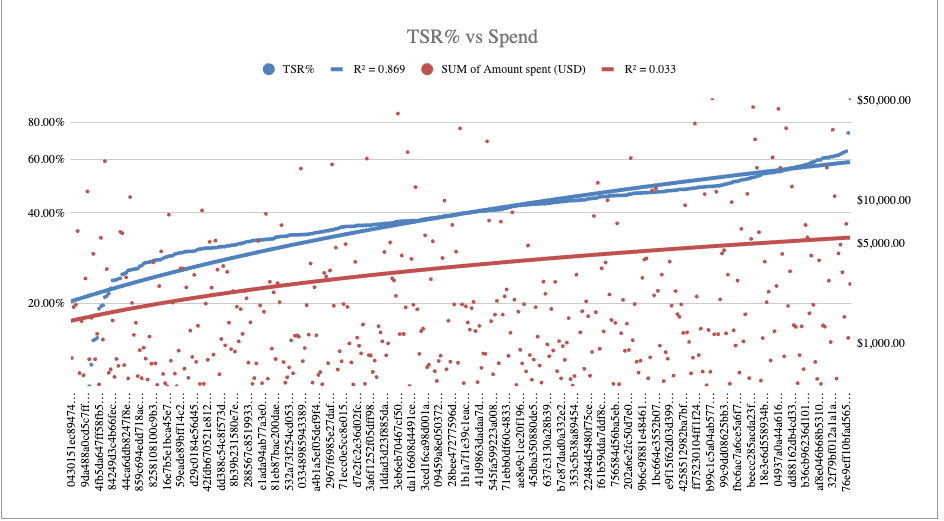
Darn, this looks like Spend is pretty flat this time with no strong R² value compared to the TSR% data. We can assume that the more we spend, the higher the TSR%, but that could just mean I’m spending more on highly engaging ads over 40%. Or, it could just be completely random noise with random dots and no association with that actual regression line. This does reveal an interesting threshold, however.
By Day
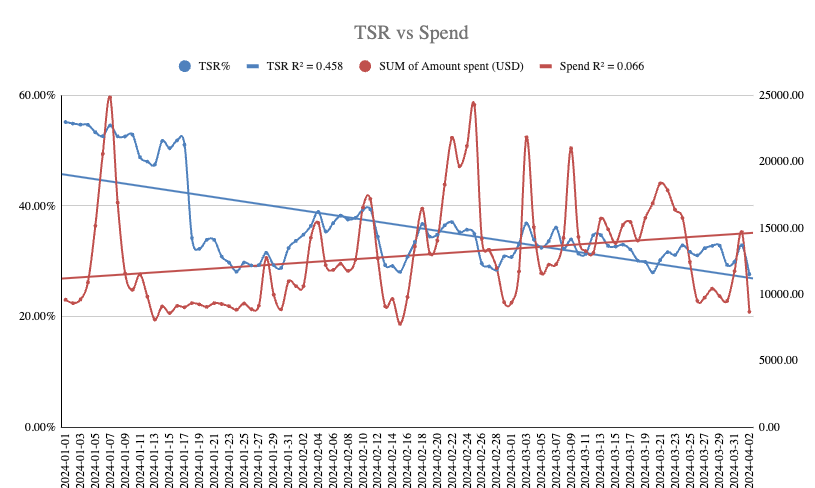
Some may argue that the issue is that my spend is inconsistent. Though that may be true, it’s still on the increase throughout the months. As you can see by this trend data, the spend is only increasing , but TSR is decreasing. But, all my other performance metrics seem to be relatively stable compared to TSR decreasing throughout the quarter.
TSR vs Revenue
If revenue is anything like spend, then we’re not going to glean too much from this chart. But let’s see anyway. The R² for Revenue is .0035 and the TSR% regression line is 22x more associated than the Revenue line.
By Ad
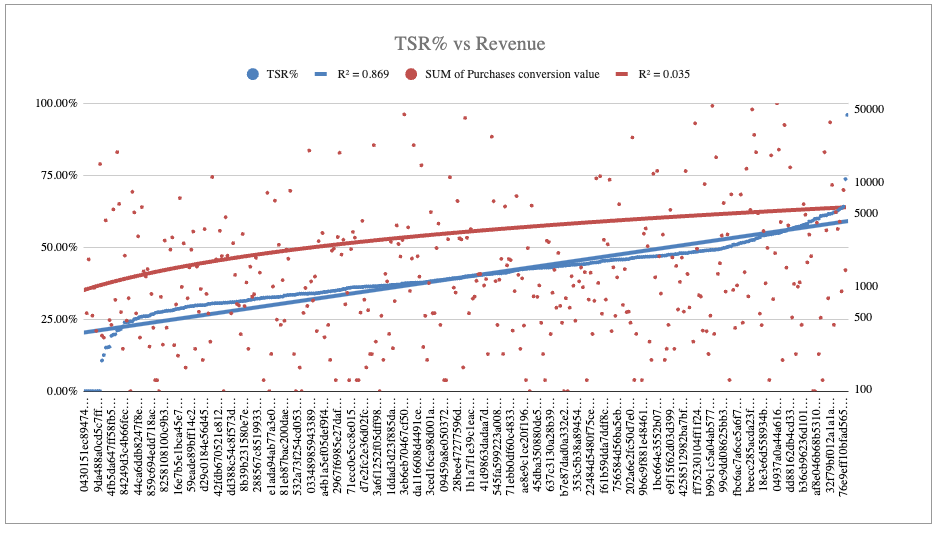
Because there is basically no association with the line and the data for the revenue, it’s hard to extrapolate a meaningful trend. If we were to look at just the lines, then it looks like as TSR% increases so does revenue. But that’s completely false because the revenue line is not representative of the data.
Discussion
So it’s hard for me to ascertain any real-world metric from this data. Effectively, I’m still confused on how to use TSR in my real-world, day-to-day media buying and optimization practice. There’s no real conclusion or correlation I can identify with any of these trends. Sure there are some nuances, but nothing noteworthy or significant.
Ok, so we plugged this data into ChatGPT (you can’t see the images, but the images above were fed) to see if the machines can figure anything out. Here’s the big idea from that dissertation:
The lower boundary of the Q3 quantile for the video plays/impressions ratio is approximately .376. This means aiming for a ratio of 3-second video plays to impressions of at least .376 could significantly enhance conversion rates, according to the dataset’s trends. Strategies to achieve or surpass this threshold could involve optimizing video content to immediately engage viewers, refining targeting to reach more receptive audiences , and testing different video formats to identify what resonates best with your target demographic.
Conclusion
Well the hypothesis is proven wrong. TSR% doesn’t impact revenue. It’s basically random. There is no correlation between TSR%, CPA, ROAS or any revenue-KPIs.
Ok, remember the discussion on the TSR and CPA? That there is a nuanced association? Well, this is where it comes into play. It seems that a 38% TSR is a strong number to aim for. That’s a generalized threshold that can be used as a vanity metric to see if your ads are hitting it or not.
If they aren’t you’re likely struggling and probably would benefit from taking a Video Ad Creative Course like the one I have available. I go over strategies to help you achieve or surpass the 38% TSR threshold for nearly all your ads. I’ll show you how to optimize video content to immediately engage viewers.
Thank you for reading through this. As always, I’d love your feedback. What have you learned by measuring your ad creative TSR?

Is your Blueprint essentials course up to date?
Yes, I am still using the same strategy every day. I teach the fundamentals so it’s cross platform and relevant for years.
The reason I ask is because I emailed you about 2 weeks ago on [email protected] but got no response.